If you want to get a heap dump of a running Java process, you can use the jmap command included in the JDK. The format is
jmap -dump:live,file=<filename> <pid>
For example,
user@some-server:/srv# ps -ef | grep java
user         1     0 99 21:25 ?        00:03:51 java -XX:+UseG1GC -XX:+UseGCOverheadLimit -XX:+UseStringDeduplication -XX:-OmitStackTraceInFastThrow -Dfile.encoding=UTF-8 -XX:+PrintGC -XX:+HeapDumpOnOutOfMemoryError -XX:HeapDumpPath=/tmp/oom.hprof -jar file.jar

user@some-server:/srv# jmap -dump:live,file=/tmp/cheap.bin 1
Dumping heap to /tmp/cheap.bin ...
Heap dump file created
Now the heap dump will be available at /tmp/cheap.bin
From here, you can use a variety of heap dump analyzers. I personally use the Eclipse Memory Analyzer, called mat for memory analyzer tool.
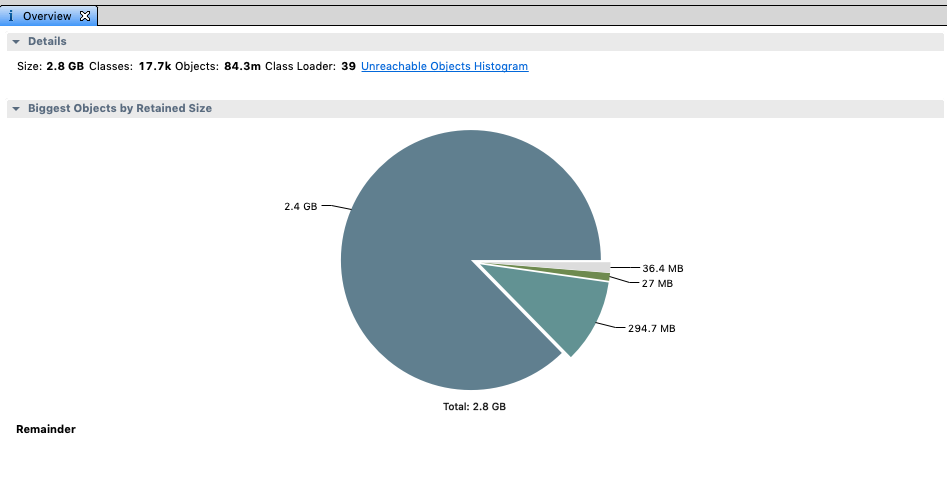
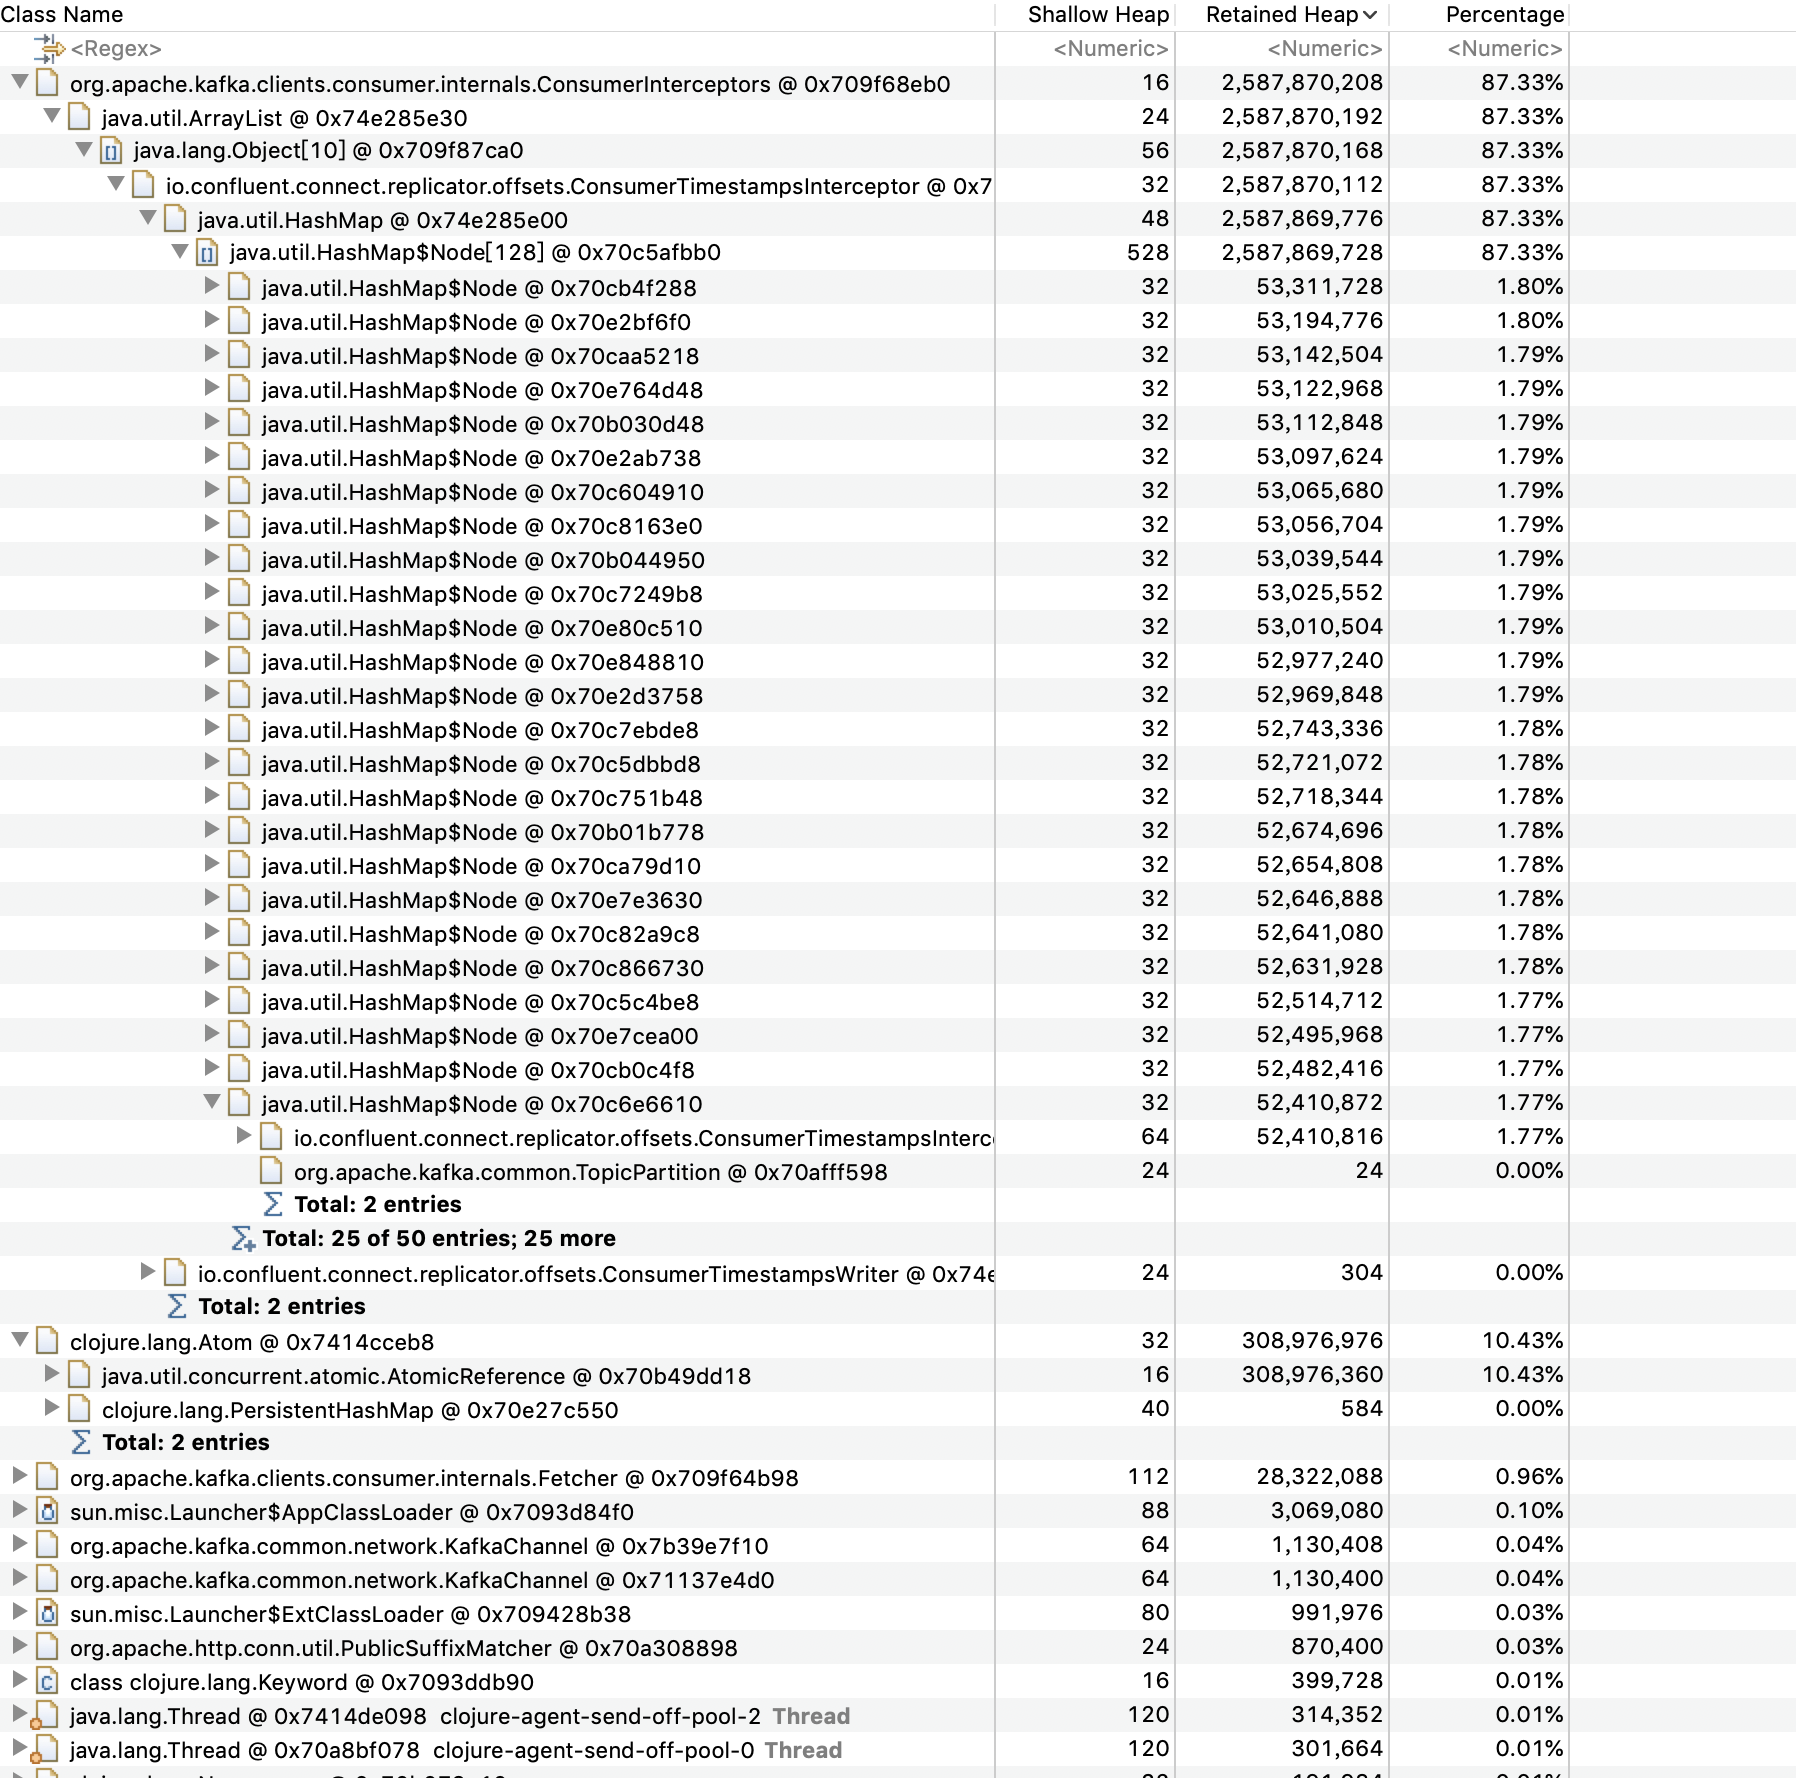
In this example, this process was used to determine the cause of a continual OutOfMemory error.